Using Video Analytics to Identify Bottlenecks in Manufacturing
Video analytics helps identify bottlenecks in manufacturing by showing where work, people, and material pile up and where they sit idle. AI cameras measure how long people stay in each zone, count forklift traffic, flag product building up in buffer areas, and track congestion at busy crossings. Recorded video then shows what is causing each delay. Instead of guessing which station limits output, you can see it.
Vulcan Security Systems designs and installs AI-powered IP video systems for manufacturing plants across Alabama. This article explains why bottlenecks are hard to find and which video analytics reveal each type. It also covers how to run a bottleneck study with cameras and where video fits next to your production data.
Why Bottlenecks Are Harder to Find Than They Look
Every line has a constraint, the one step that limits how much the whole operation can produce. In theory, it is easy to spot. In practice, it moves. A station that limits output on first shift may run fine on second. A changeover, a material delay, or a forklift shortage can shift the constraint for hours at a time.
Production data tells you that output fell short. However, it rarely shows why. Was the machine slow, was it starved for material, or was the operator waiting on a forklift? Traditional time studies answer those questions, but they cover a few hours with a clipboard. Bottlenecks in manufacturing often hide in the hours nobody studied.
Throughput is also a growing priority for Alabama plants. In April 2026, Mercedes-Benz announced a $4 billion investment in its Tuscaloosa plant by 2030, including production system upgrades, automation, and capacity expansion. Suppliers to plants like that face steady pressure to produce more from the same floor space. For them, finding bottlenecks in manufacturing is often cheaper than adding equipment.
The Most Common Bottlenecks Video Analytics Can Reveal
Work Piling Up in Front of a Station
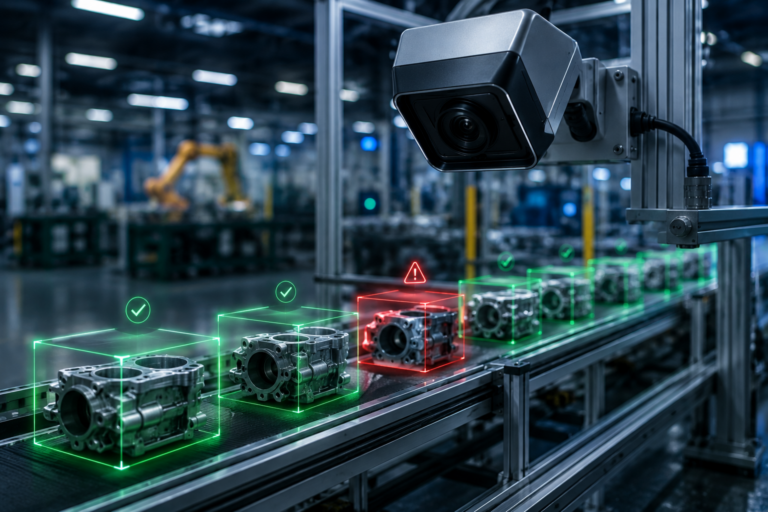
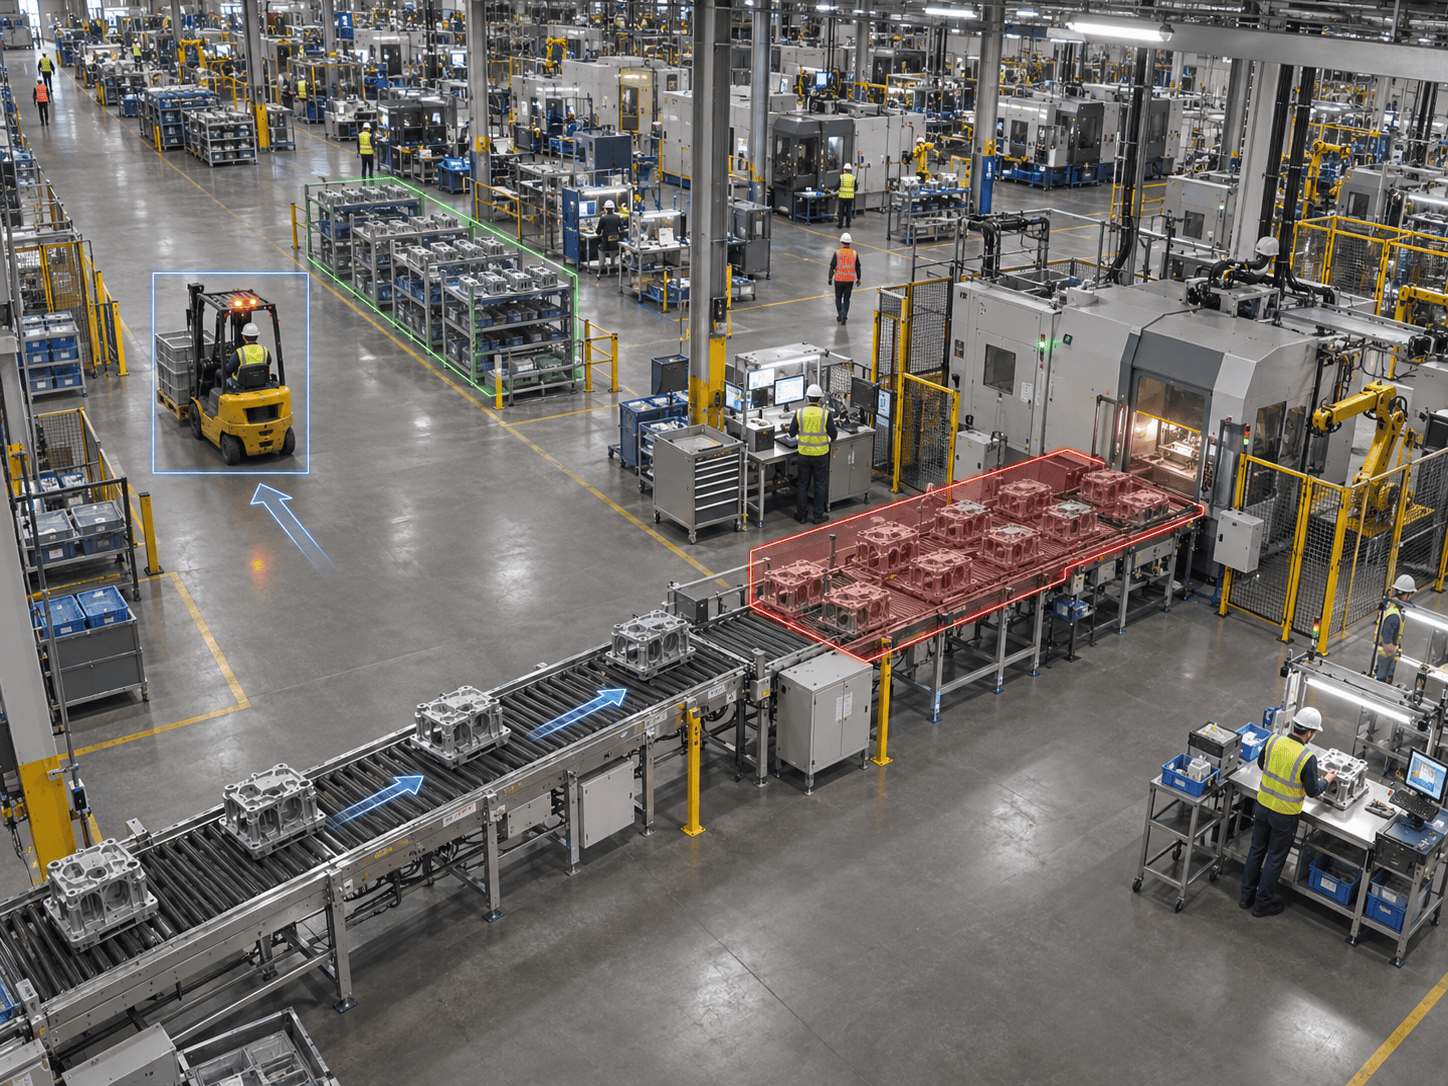
The classic sign of a constraint is inventory stacking up in front of it. Cameras watching buffer zones can flag when product accumulates past a normal level. Every event carries a timestamp. So you can see when the pile starts, how long it lasts, and what happened upstream right before.
The reverse matters too. An empty buffer after a station means the next step is starved. Together, the full and empty zones point straight at the constraint.
Forklifts and Material Handlers Waiting
Many bottlenecks are not machines at all. They are material delivery. Vehicle detection and counting can log forklifts as they enter staging areas, cross aisle thresholds, or queue at a dock. When forklifts consistently wait in one area, that area is likely holding up the line.
The same data shows whether you have too few forklifts or simply poor routing. That distinction changes the fix from a purchase to a schedule change.
Crowded Stations and Underused Space
Occupancy analytics measures how many people are in each zone and how long they stay. A station where people bunch up may be understaffed or poorly laid out. In contrast, an area that sits empty most of the shift may be space you can reclaim.
This is about the process, not about any single worker. The goal is to see where the layout or staffing plan does not match the real flow of work.
Congestion at Aisle Crossings and Doors
People counting and vehicle counting at key crossings show how much traffic each point really handles. A single doorway shared by forklifts and foot traffic can slow an entire area. Queue detection, meanwhile, flags when traffic backs up past a set level.
Congestion points are also safety risks. We cover that side in our post on using AI to prevent forklift-pedestrian accidents.
Rework Loops That Eat Capacity
Rework is a hidden bottleneck. Parts that fail inspection loop back through a station and take capacity from good parts. AI quality control flags defects at the inspection point, and the timestamps show when defect rates climb. As a result, you can link a spike in rework to a specific shift, tool, or material lot.
We cover the inspection side in more detail in AI-based quality control: catching defects on the line.
Stops and Slowdowns Nobody Logged
Short stops of a minute or two rarely make it into the downtime log. Yet across a shift, they can cost more than one long breakdown. Cameras that watch product flow can flag those micro-stops as they happen. We explain how in how AI cameras can detect production line stoppages.
How to Run a Bottleneck Study With Video Analytics
A camera-based study works best with a clear question and a set time frame. Here is the approach we recommend:
- Start with a question. For example, “Why does line two miss its target on second shift?” A clear question keeps the study focused.
- Map the flow. Mark stations, buffers, staging areas, and crossings on a floor plan.
- Place cameras at buffers and handoffs. These are where waiting shows up first. Industrial IP video cameras hold up to the dust and vibration of a production floor.
- Collect two to four weeks of data. Cover every shift and at least one changeover, so you see how the constraint moves.
- Review the patterns, then the clips. Let the analytics point to the problem areas. Then watch the video to understand the cause.
- Make one change and measure again. The same cameras show whether the fix worked.
What the Results Usually Look Like
Most studies produce one or two clear findings. For example, a buffer that fills every afternoon, or a staging area where forklifts wait twenty minutes per hour. Those findings are what make bottlenecks in manufacturing fixable, because they point to a specific place and time.
Expect some findings to surprise you. Teams often assume a slow machine is the constraint, only to find the real delay is material arriving late. Video makes that kind of finding hard to argue with, which helps when you need support for a change.
Tell your team what the study is for before it starts. In our experience, people are far more supportive when they know the cameras are looking at the process, not grading individuals. Many teams end up suggesting fixes once they see the footage themselves.
Some analytics need specific camera models, which our AI camera capabilities page lists. Also, AI processing runs on the camera itself, so your video stays on your own network.
Video Analytics vs. Production Data: When to Use Each
Video does not replace your production system or your downtime log. Each answers a different part of the question.
- Production and machine data tell you what each machine produced and when it stopped. Keep them as your scoreboard.
- Video analytics shows what happened around the machines: waiting, crowding, congestion, and material delays.
- Manual time studies still help for detailed task analysis. However, video lets you review any shift, not just the hours someone stood there.
Plants with little machine data get the most new information from cameras. Even so, plants with rich data often find that video explains the gaps their dashboards cannot.
There is a practical bonus, too. Cameras placed for a bottleneck study keep working afterward for safety, quality, and security. A study camera rarely becomes a wasted camera. Over time, our proactive service maintenance keeps them online so the data stays complete.
Quick Checklist: Signs a Video Study Would Help
- Output varies a lot between shifts on the same line.
- Product regularly stacks up in front of one or two stations.
- Operators often wait for material or forklifts.
- Your downtime log shows fewer stops than the floor seems to have.
- The last time study is more than a year old.
- You are planning a layout change and want a baseline first.
You Cannot Fix the Constraint You Cannot See
Bottlenecks in manufacturing move between shifts, products, and seasons, which is why a single time study rarely finds them all. Video analytics watches every shift. It measures where work piles up, where forklifts wait, where people crowd, and where traffic jams. Then the recorded video shows why. Paired with your production data, that view turns a vague output problem into a specific fix you can measure.
If you want to find out where your line is really losing time, Vulcan will walk your floor with your team and show you where cameras would reveal the most.
Frequently Asked Questions
Can video analytics calculate OEE?
Not on its own. OEE depends on machine and production data. Video analytics explains the causes behind the availability and performance losses that OEE reports.
How long should a camera-based bottleneck study run?
Two to four weeks usually covers every shift and several changeovers. Longer studies help when demand or product mix changes a lot from week to week.
Is this a way to monitor individual workers?
It should not be. The analytics measure zones, traffic, and material flow. We recommend telling your team that the study focuses on the process, which also leads to better ideas from the people doing the work.
Can we use our existing security cameras?
Sometimes, for basic video review. Most analytics need specific camera models and placements aimed at buffers and handoffs. A site walk shows what your current system can support.
What happens to the cameras after the study?
They keep working. Most plants use them afterward for ongoing monitoring, safety, and security, so the investment does not end with the study.